Section
Pollution.Passive smoking
Data summary
Qc
|
Variable
|
Stats / Values
|
Freqs (% of Valid)
|
Graph
|
Missing
|
|
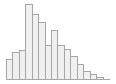
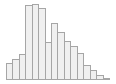
smoke_exposure
[factor]
|
- Never or almost never
|
- Occasionally (<1 time/wee
|
- 1-2 days/week
|
- 3-5 days/week
|
- Daily or almost every day
|
|
|
3096
|
(
|
19.6%
|
)
|
|
2832
|
(
|
17.9%
|
)
|
|
1518
|
(
|
9.6%
|
)
|
|
1518
|
(
|
9.6%
|
)
|
|
6852
|
(
|
43.3%
|
)
|
|

|
0 (0.0%)
|
Generated by
summarytools
1.0.1 (R version
4.3.1)
2024-02-27
Resurvey 2
|
Variable
|
Stats / Values
|
Freqs (% of Valid)
|
Graph
|
Missing
|
|
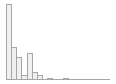
ever_lived_with_smoker
[factor]
|
- Never
|
- Yes, but not now
|
- Yes, at present
|
|
|
11533
|
(
|
46.0%
|
)
|
|
3961
|
(
|
15.8%
|
)
|
|
9560
|
(
|
38.2%
|
)
|
|

|
198 (0.8%)
|
|
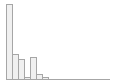
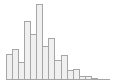
lived_with_smoker_years
[integer]
|
|
Mean (sd) : 28.6 (14.6)
|
|
min ≤ med ≤ max:
|
|
1 ≤ 28 ≤ 82
|
|
IQR (CV) : 19 (0.5)
|
|
82 distinct values
|
|
11731 (46.5%)
|
Generated by
summarytools
1.0.1 (R version
4.3.1)
2024-02-27
International Coordinating Centre, China Kadoorie Biobank (CKB),
CTSU, Nuffield Department of Population Health, University of Oxford Old
Road Campus, Headington, Oxford, OX3 7LF
Tel: +44 (0)1865 743743 | Fax: +44
(0)1865 743985 | Email: ckbaccess@ndph.ox.ac.uk
Copyright China Kadoorie Biobank (CKB), University of Oxford,
(2024)
Page generated: 27-02-2024