|
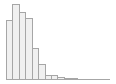
house_years_present
[integer]
|
|
Mean (sd) : 13 (9.6)
|
|
min ≤ med ≤ max:
|
|
1 ≤ 11 ≤ 77
|
|
IQR (CV) : 12 (0.7)
|
|
77 distinct values
|
|
0 (0.0%)
|
|
cooking_freq_present
[factor]
|
- Daily
|
- Weekly
|
- Monthly
|
- Never/Rarely
|
- No cooking facility
|
|
|
302913
|
(
|
58.8%
|
)
|
|
60694
|
(
|
11.8%
|
)
|
|
20092
|
(
|
3.9%
|
)
|
|
130956
|
(
|
25.4%
|
)
|
|
758
|
(
|
0.1%
|
)
|
|

|
0 (0.0%)
|
|
cooking_fuel_present
[factor]
|
- Gas
|
- Coal
|
- Wood
|
- Electricity
|
- Other
|
|
|
184615
|
(
|
48.1%
|
)
|
|
103394
|
(
|
26.9%
|
)
|
|
82261
|
(
|
21.4%
|
)
|
|
10688
|
(
|
2.8%
|
)
|
|
2741
|
(
|
0.7%
|
)
|
|

|
131714 (25.6%)
|
|
cooking_oil_present
[factor]
|
- Rapeseed
|
- Peanut
|
- Soybean
|
- Lard
|
- Other
|
|
|
126247
|
(
|
32.9%
|
)
|
|
95769
|
(
|
25.0%
|
)
|
|
66127
|
(
|
17.2%
|
)
|
|
41497
|
(
|
10.8%
|
)
|
|
54059
|
(
|
14.1%
|
)
|
|

|
131714 (25.6%)
|
|
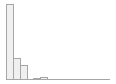
cooking_today_mins
[integer]
|
|
Mean (sd) : 17.6 (24.7)
|
|
min ≤ med ≤ max:
|
|
0 ≤ 0 ≤ 640
|
|
IQR (CV) : 30 (1.4)
|
|
116 distinct values
|
|
131714 (25.6%)
|
|
chimney_present
[factor]
|
|
|
229600
|
(
|
44.6%
|
)
|
|
163023
|
(
|
31.7%
|
)
|
|
122032
|
(
|
23.7%
|
)
|
|

|
758 (0.1%)
|
|
slow_b_present
[factor]
|
- Yes, always
|
- Yes, sometimes
|
- No
|
|
|
147421
|
(
|
28.6%
|
)
|
|
69439
|
(
|
13.5%
|
)
|
|
297795
|
(
|
57.9%
|
)
|
|

|
758 (0.1%)
|
|
slow_b_fuel_present
[factor]
|
- Smokeless coal
|
- Smoky coal
|
- Coal brick / Coalite
|
- Other
|
|
|
93130
|
(
|
42.9%
|
)
|
|
14732
|
(
|
6.8%
|
)
|
|
108187
|
(
|
49.9%
|
)
|
|
811
|
(
|
0.4%
|
)
|
|

|
298553 (57.9%)
|
|
slow_b_loc_present
[factor]
|
- Inside the house
|
- Outside the house
|
|
|
188608
|
(
|
87.0%
|
)
|
|
28252
|
(
|
13.0%
|
)
|
|

|
298553 (57.9%)
|
|
winter_heat_present
[factor]
|
|
|
218899
|
(
|
42.5%
|
)
|
|
296514
|
(
|
57.5%
|
)
|
|

|
0 (0.0%)
|
|
heating_fuel_present
[factor]
|
- Central heating
|
- Gas
|
- Coal
|
- Wood
|
- Electricity
|
- Other
|
|
|
62763
|
(
|
21.2%
|
)
|
|
497
|
(
|
0.2%
|
)
|
|
117152
|
(
|
39.5%
|
)
|
|
71806
|
(
|
24.2%
|
)
|
|
42264
|
(
|
14.3%
|
)
|
|
2031
|
(
|
0.7%
|
)
|
|

|
218900 (42.5%)
|