Section_overview
Release database: 18.01

Section
Tea Consumption.Basic
Data summary
Baseline
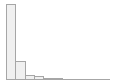
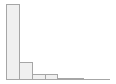
| Variable | Stats / Values | Freqs (% of Valid) | Graph | Missing | |||||||||||||||||||||||||
|---|---|---|---|---|---|---|---|---|---|---|---|---|---|---|---|---|---|---|---|---|---|---|---|---|---|---|---|---|---|
| tea_year [factor] |
|
|

|
0 (0.0%) | |||||||||||||||||||||||||
| tea_drank_in_past [factor] |
|
|

|
171888 (33.3%) | |||||||||||||||||||||||||
| tea_years_ago [integer] |
|
52 distinct values |
|
503790 (97.7%) | |||||||||||||||||||||||||
| tea_weekly [factor] |
|
|

|
343525 (66.7%) |
Generated by
summarytools
1.0.1 (R version
4.3.1)
2024-02-27
Qc
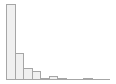
| Variable | Stats / Values | Freqs (% of Valid) | Graph | Missing | |||||||||||||||||||||||||
|---|---|---|---|---|---|---|---|---|---|---|---|---|---|---|---|---|---|---|---|---|---|---|---|---|---|---|---|---|---|
| tea_year [factor] |
|
|

|
0 (0.0%) |
Generated by
summarytools
1.0.1 (R version
4.3.1)
2024-02-27
Resurvey 1
| Variable | Stats / Values | Freqs (% of Valid) | Graph | Missing | |||||||||||||||||||||||||
|---|---|---|---|---|---|---|---|---|---|---|---|---|---|---|---|---|---|---|---|---|---|---|---|---|---|---|---|---|---|
| tea_year [factor] |
|
|

|
0 (0.0%) | |||||||||||||||||||||||||
| tea_drank_in_past [factor] |
|
|

|
5515 (27.8%) | |||||||||||||||||||||||||
| tea_years_ago [integer] |
|
24 distinct values |
|
19436 (98.1%) | |||||||||||||||||||||||||
| tea_weekly [factor] |
|
|
|
14288 (72.2%) |
Generated by
summarytools
1.0.1 (R version
4.3.1)
2024-02-27
Resurvey 2
| Variable | Stats / Values | Freqs (% of Valid) | Graph | Missing | |||||||||||||||||||||||||
|---|---|---|---|---|---|---|---|---|---|---|---|---|---|---|---|---|---|---|---|---|---|---|---|---|---|---|---|---|---|
| tea_year [factor] |
|
|

|
198 (0.8%) | |||||||||||||||||||||||||
| tea_drank_in_past [factor] |
|
|

|
7361 (29.2%) | |||||||||||||||||||||||||
| tea_years_ago [integer] |
|
30 distinct values |
|
24627 (97.5%) | |||||||||||||||||||||||||
| tea_weekly [factor] |
|
|

|
18088 (71.6%) |
Generated by
summarytools
1.0.1 (R version
4.3.1)
2024-02-27
International Coordinating Centre, China Kadoorie Biobank (CKB), CTSU, Nuffield Department of Population Health, University of Oxford Old Road Campus, Headington, Oxford, OX3 7LF
Tel: +44 (0)1865 743743 | Fax: +44 (0)1865 743985 | Email: ckbaccess@ndph.ox.ac.uk
Copyright China Kadoorie Biobank (CKB), University of Oxford, (2024)
Page generated: 27-02-2024