Section_overview
Release database: 18.01

Section
Physical Activity.Weight change
Data summary
Baseline
| Variable | Stats / Values | Freqs (% of Valid) | Graph | Missing | |||||||||||||||
|---|---|---|---|---|---|---|---|---|---|---|---|---|---|---|---|---|---|---|---|
| tried_to_reduce_weight [factor] |
|
|

|
0 (0.0%) | |||||||||||||||
| weight_changed [factor] |
|
|

|
0 (0.0%) | |||||||||||||||
| age_25_weight_jin [integer] |
|
172 distinct values |
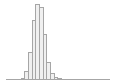
|
82703 (16.0%) |
Generated by
summarytools
1.0.1 (R version
4.3.1)
2024-02-27
Resurvey 1
| Variable | Stats / Values | Freqs (% of Valid) | Graph | Missing | |||||||||||||||
|---|---|---|---|---|---|---|---|---|---|---|---|---|---|---|---|---|---|---|---|
| tried_to_reduce_weight [factor] |
|
|

|
0 (0.0%) | |||||||||||||||
| weight_changed [factor] |
|
|

|
0 (0.0%) | |||||||||||||||
| age_25_weight_jin [integer] |
|
114 distinct values |
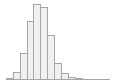
|
3112 (15.7%) |
Generated by
summarytools
1.0.1 (R version
4.3.1)
2024-02-27
Resurvey 2
| Variable | Stats / Values | Freqs (% of Valid) | Graph | Missing | |||||||||||||||
|---|---|---|---|---|---|---|---|---|---|---|---|---|---|---|---|---|---|---|---|
| tried_to_reduce_weight [factor] |
|
|

|
198 (0.8%) | |||||||||||||||
| weight_changed [factor] |
|
|

|
198 (0.8%) | |||||||||||||||
| age_25_weight_jin [integer] |
|
124 distinct values |
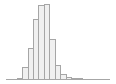
|
3504 (13.9%) |
Generated by
summarytools
1.0.1 (R version
4.3.1)
2024-02-27
International Coordinating Centre, China Kadoorie Biobank (CKB), CTSU, Nuffield Department of Population Health, University of Oxford Old Road Campus, Headington, Oxford, OX3 7LF
Tel: +44 (0)1865 743743 | Fax: +44 (0)1865 743985 | Email: ckbaccess@ndph.ox.ac.uk
Copyright China Kadoorie Biobank (CKB), University of Oxford, (2024)
Page generated: 27-02-2024