Section_overview
Release database: 18.01

Section
Physical Activity.Non-agricultural workers
Data summary
Baseline
| Variable | Stats / Values | Freqs (% of Valid) | Graph | Missing | |||||||||||||||||||||||||
|---|---|---|---|---|---|---|---|---|---|---|---|---|---|---|---|---|---|---|---|---|---|---|---|---|---|---|---|---|---|
| has_urban_phys_activities [factor] |
|
|

|
0 (0.0%) | |||||||||||||||||||||||||
| work_activity_level [factor] |
|
|

|
214216 (41.6%) | |||||||||||||||||||||||||
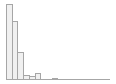
| work_hours_per_week [integer] |
|
99 distinct values |
|
368302 (71.5%) | |||||||||||||||||||||||||
| work_journey_mode [factor] |
|
|

|
368302 (71.5%) | |||||||||||||||||||||||||
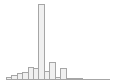
| work_journey_mins [integer] |
|
105 distinct values |
|
394271 (76.5%) |
Generated by
summarytools
1.0.1 (R version
4.3.1)
2024-02-27
Resurvey 1
| Variable | Stats / Values | Freqs (% of Valid) | Graph | Missing | |||||||||||||||||||||||||
|---|---|---|---|---|---|---|---|---|---|---|---|---|---|---|---|---|---|---|---|---|---|---|---|---|---|---|---|---|---|
| has_urban_phys_activities [factor] |
|
|

|
0 (0.0%) | |||||||||||||||||||||||||
| work_activity_level [factor] |
|
|

|
8048 (40.6%) | |||||||||||||||||||||||||
| work_hours_per_week [integer] |
|
80 distinct values |
|
14913 (75.3%) | |||||||||||||||||||||||||
| work_journey_mode [factor] |
|
|

|
14913 (75.3%) | |||||||||||||||||||||||||
| work_journey_mins [integer] |
|
46 distinct values |
|
15777 (79.7%) |
Generated by
summarytools
1.0.1 (R version
4.3.1)
2024-02-27
Resurvey 2
| Variable | Stats / Values | Freqs (% of Valid) | Graph | Missing | ||||||||||||||||||||||||||||||||||||||||||||||
|---|---|---|---|---|---|---|---|---|---|---|---|---|---|---|---|---|---|---|---|---|---|---|---|---|---|---|---|---|---|---|---|---|---|---|---|---|---|---|---|---|---|---|---|---|---|---|---|---|---|---|
| has_urban_phys_activities [factor] |
|
|

|
198 (0.8%) | ||||||||||||||||||||||||||||||||||||||||||||||
| work_activity_level [factor] |
|
|

|
6387 (25.3%) | ||||||||||||||||||||||||||||||||||||||||||||||
| work_journey_mins [integer] |
|
63 distinct values |
|
19413 (76.9%) | ||||||||||||||||||||||||||||||||||||||||||||||
| work_days_per_week [integer] |
|
|

|
18378 (72.8%) | ||||||||||||||||||||||||||||||||||||||||||||||
| work_hours_per_day [integer] |
|
20 distinct values |
|
18378 (72.8%) | ||||||||||||||||||||||||||||||||||||||||||||||
| work_journey_mode2 [factor] |
|
|

|
18378 (72.8%) |
Generated by
summarytools
1.0.1 (R version
4.3.1)
2024-02-27
International Coordinating Centre, China Kadoorie Biobank (CKB), CTSU, Nuffield Department of Population Health, University of Oxford Old Road Campus, Headington, Oxford, OX3 7LF
Tel: +44 (0)1865 743743 | Fax: +44 (0)1865 743985 | Email: ckbaccess@ndph.ox.ac.uk
Copyright China Kadoorie Biobank (CKB), University of Oxford, (2024)
Page generated: 27-02-2024