Section_overview
Release database: 18.01

Section
Meteorological Data.Weather
Data summary
Baseline
| Variable | Stats / Values | Freqs (% of Valid) | Graph | Missing | ||||||||||
|---|---|---|---|---|---|---|---|---|---|---|---|---|---|---|
| has_participant_weather [factor] |
|
|

|
0 (0.0%) | ||||||||||
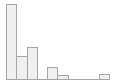
| mean_air_pressure [numeric] |
|
1254 distinct values |
|
40816 (7.9%) | ||||||||||
| max_air_pressure [numeric] |
|
462 distinct values |
|
357493 (69.4%) | ||||||||||
| min_air_pressure [numeric] |
|
470 distinct values |
|
357586 (69.4%) | ||||||||||
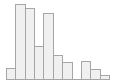
| mean_temp [numeric] |
|
965 distinct values |
|
6220 (1.2%) | ||||||||||
| max_temp [numeric] |
|
525 distinct values |
|
6256 (1.2%) | ||||||||||
| min_temp [numeric] |
|
519 distinct values |
|
6136 (1.2%) | ||||||||||
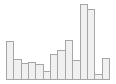
| mean_relative_humidity [numeric] |
|
301 distinct values |
|
115821 (22.5%) | ||||||||||
| max_relative_humidity [numeric] |
|
58 distinct values |
|
478948 (92.9%) | ||||||||||
| min_relative_humidity [numeric] |
|
96 distinct values |
|
247808 (48.1%) | ||||||||||
| precipitation [numeric] |
|
162 distinct values |

|
473101 (91.8%) | ||||||||||
| mean_wind_speed [numeric] |
|
126 distinct values |
|
420881 (81.7%) | ||||||||||
| sunshine [numeric] |
|
143 distinct values |
|
457346 (88.7%) | ||||||||||
| cloud_cover [numeric] |
|
38 distinct values |
|
507806 (98.5%) |
Generated by
summarytools
1.0.1 (R version
4.3.1)
2024-02-27
Resurvey 1
| Variable | Stats / Values | Freqs (% of Valid) | Graph | Missing | ||||||||||||||||||||||||||||
|---|---|---|---|---|---|---|---|---|---|---|---|---|---|---|---|---|---|---|---|---|---|---|---|---|---|---|---|---|---|---|---|---|
| has_participant_weather [factor] |
|
|

|
0 (0.0%) | ||||||||||||||||||||||||||||
| mean_air_pressure [numeric] |
|
119 distinct values |
|
10657 (53.8%) | ||||||||||||||||||||||||||||
| max_air_pressure [numeric] |
|
52 distinct values |
|
16068 (81.1%) | ||||||||||||||||||||||||||||
| min_air_pressure [numeric] |
|
48 distinct values |
|
16068 (81.1%) | ||||||||||||||||||||||||||||
| mean_temp [numeric] |
|
104 distinct values |
|
9967 (50.3%) | ||||||||||||||||||||||||||||
| max_temp [numeric] |
|
108 distinct values |
|
9967 (50.3%) | ||||||||||||||||||||||||||||
| min_temp [numeric] |
|
95 distinct values |
|
9967 (50.3%) | ||||||||||||||||||||||||||||
| mean_relative_humidity [numeric] |
|
48 distinct values |
|
12112 (61.2%) | ||||||||||||||||||||||||||||
| max_relative_humidity [numeric] |
|
|

|
19083 (96.4%) | ||||||||||||||||||||||||||||
| min_relative_humidity [numeric] |
|
48 distinct values |
|
14613 (73.8%) | ||||||||||||||||||||||||||||
| precipitation [numeric] |
|
15 distinct values |
|
18746 (94.7%) | ||||||||||||||||||||||||||||
| mean_wind_speed [numeric] |
|
34 distinct values |
|
16989 (85.8%) | ||||||||||||||||||||||||||||
| sunshine [numeric] |
|
37 distinct values |
|
17709 (89.4%) | ||||||||||||||||||||||||||||
| cloud_cover [numeric] |
|
22 distinct values |
|
17709 (89.4%) |
Generated by
summarytools
1.0.1 (R version
4.3.1)
2024-02-27
Resurvey 2
| Variable | Stats / Values | Freqs (% of Valid) | Graph | Missing | ||||||||||
|---|---|---|---|---|---|---|---|---|---|---|---|---|---|---|
| has_participant_weather [factor] |
|
|

|
0 (0.0%) | ||||||||||
| mean_air_pressure [numeric] |
|
|
25252 (100.0%) | |||||||||||
| max_air_pressure [numeric] |
|
|
25252 (100.0%) | |||||||||||
| min_air_pressure [numeric] |
|
|
25252 (100.0%) | |||||||||||
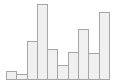
| mean_temp [numeric] |
|
272 distinct values |
|
170 (0.7%) | ||||||||||
| max_temp [numeric] |
|
261 distinct values |

|
170 (0.7%) | ||||||||||
| min_temp [numeric] |
|
289 distinct values |

|
916 (3.6%) | ||||||||||
| mean_relative_humidity [numeric] |
|
348 distinct values |

|
170 (0.7%) | ||||||||||
| max_relative_humidity [numeric] |
|

|
25252 (100.0%) | |||||||||||
| min_relative_humidity [numeric] |
|

|
25252 (100.0%) | |||||||||||
| precipitation [numeric] |
|

|
25252 (100.0%) | |||||||||||
| mean_wind_speed [numeric] |
|

|
25252 (100.0%) | |||||||||||
| sunshine [numeric] |
|

|
25252 (100.0%) | |||||||||||
| cloud_cover [numeric] |
|

|
25252 (100.0%) |
Generated by
summarytools
1.0.1 (R version
4.3.1)
2024-02-27
International Coordinating Centre, China Kadoorie Biobank (CKB), CTSU, Nuffield Department of Population Health, University of Oxford Old Road Campus, Headington, Oxford, OX3 7LF
Tel: +44 (0)1865 743743 | Fax: +44 (0)1865 743985 | Email: ckbaccess@ndph.ox.ac.uk
Copyright China Kadoorie Biobank (CKB), University of Oxford, (2024)
Page generated: 27-02-2024