Variable breakdown
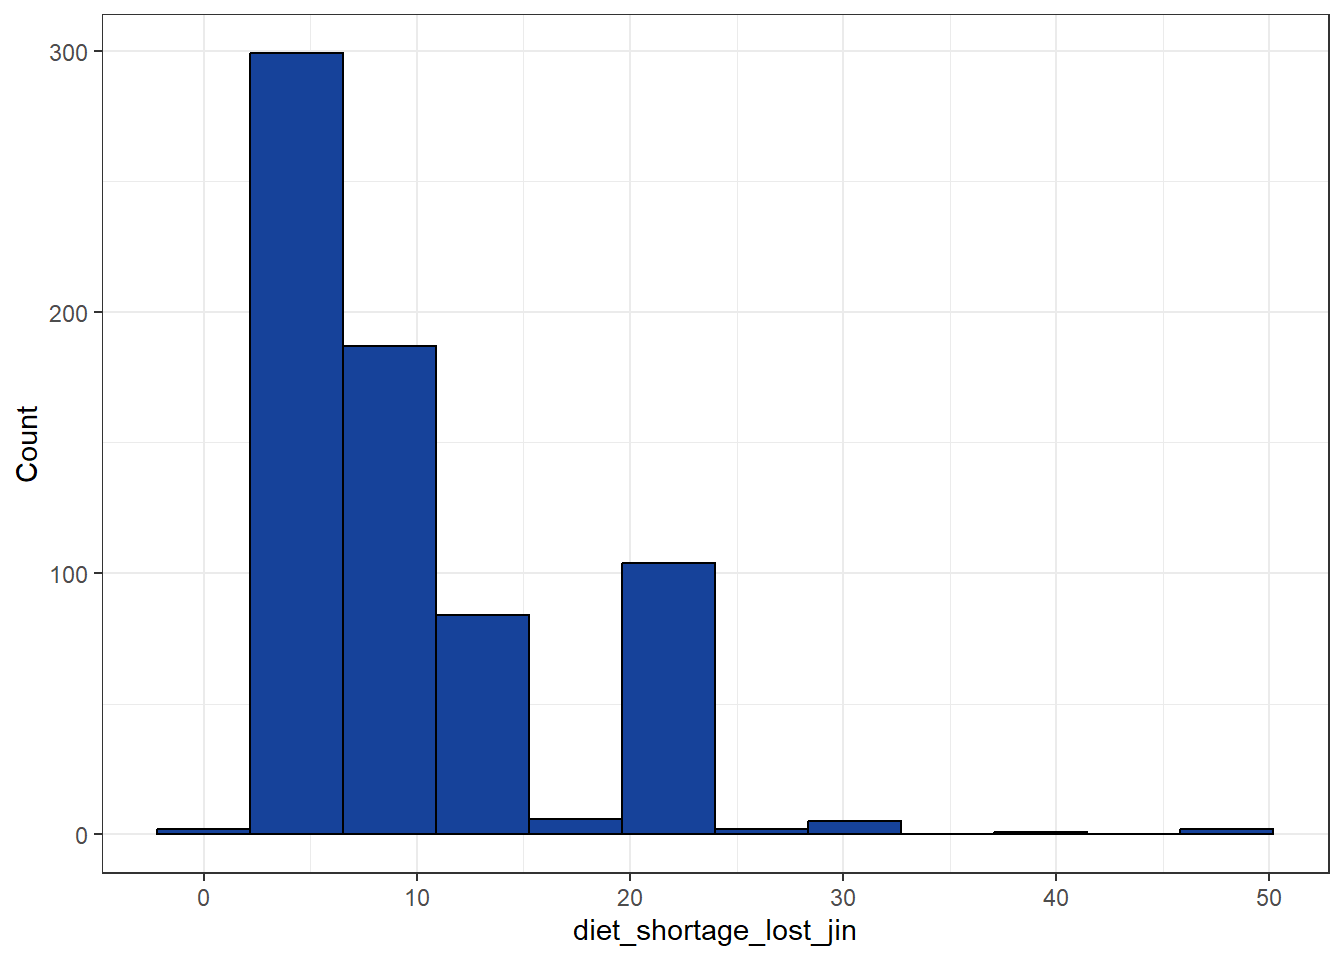
diet_shortage_lost_jin

Section and category
Diet.Food shortages
Description
“During the most severe food shortage you experienced, about how much weight did you lose?”
Additional information
| Metadata | |
|---|---|
| contents | No. of jin |
| soft_min | 5 |
| soft_max | 30 |
| hard_min | 1 |
| hard_max | 99 |
| is_mandatory | No |
| is_dependent_on | diet_had_shortage |
Data summary
Baseline

| mean | sd | min | q1 | med | q3 | max | mad | iqr | cv | skewness | se.skewness | kurtosis | n.valid | pct.valid |
|---|---|---|---|---|---|---|---|---|---|---|---|---|---|---|
| 7.37 | 4.56 | 1 | 5 | 5 | 10 | 95 | 0 | 5 | 0.62 | 3.56 | 0.01 | 29.29 | 40021 | 7.76 |
Resurvey 1
| mean | sd | min | q1 | med | q3 | max | mad | iqr | cv | skewness | se.skewness | kurtosis | n.valid | pct.valid |
|---|---|---|---|---|---|---|---|---|---|---|---|---|---|---|
| 10.22 | 6.18 | 2 | 5 | 10 | 15 | 50 | 7.41 | 10 | 0.6 | 1.52 | 0.09 | 4.18 | 692 | 3.49 |
Resurvey 2

| mean | sd | min | q1 | med | q3 | max | mad | iqr | cv | skewness | se.skewness | kurtosis | n.valid | pct.valid |
|---|---|---|---|---|---|---|---|---|---|---|---|---|---|---|
| 20.18 | 21.88 | 2 | 10 | 10 | 20 | 80 | 7.41 | 10 | 1.08 | 2.07 | 0.06 | 2.98 | 1792 | 7.1 |
Between-survey agreement
[1] “Spearman’s correlation matrix:”| Baseline | Resurvey1 | Resurvey2 | |
|---|---|---|---|
| Baseline | 1.000 | 0.289 | 0.250 |
| Resurvey1 | 0.289 | 1.000 | 0.362 |
| Resurvey2 | 0.250 | 0.362 | 1.000 |
International Coordinating Centre, China Kadoorie Biobank (CKB), CTSU, Nuffield Department of Population Health, University of Oxford Old Road Campus, Headington, Oxford, OX3 7LF
Tel: +44 (0)1865 743743 | Fax: +44 (0)1865 743985 | Email: ckbaccess@ndph.ox.ac.uk
Copyright China Kadoorie Biobank (CKB), University of Oxford, (2024)
Page generated: 27-02-2024