Variable breakdown
cidi_a2a_x10

Section and category
Psychological.CIDI A
Description
“Think of the two-week period during the past 12 months when you felt most depressed. About how much did you gain/you lose/your weight change?”
Additional information
| Metadata | |
|---|---|
| contents | Average no. of jin (x10) |
| hard_min | 10 |
| hard_max | 1000 |
| is_mandatory | No |
| is_dependent_on | cidi_a1 |
Data summary
Baseline
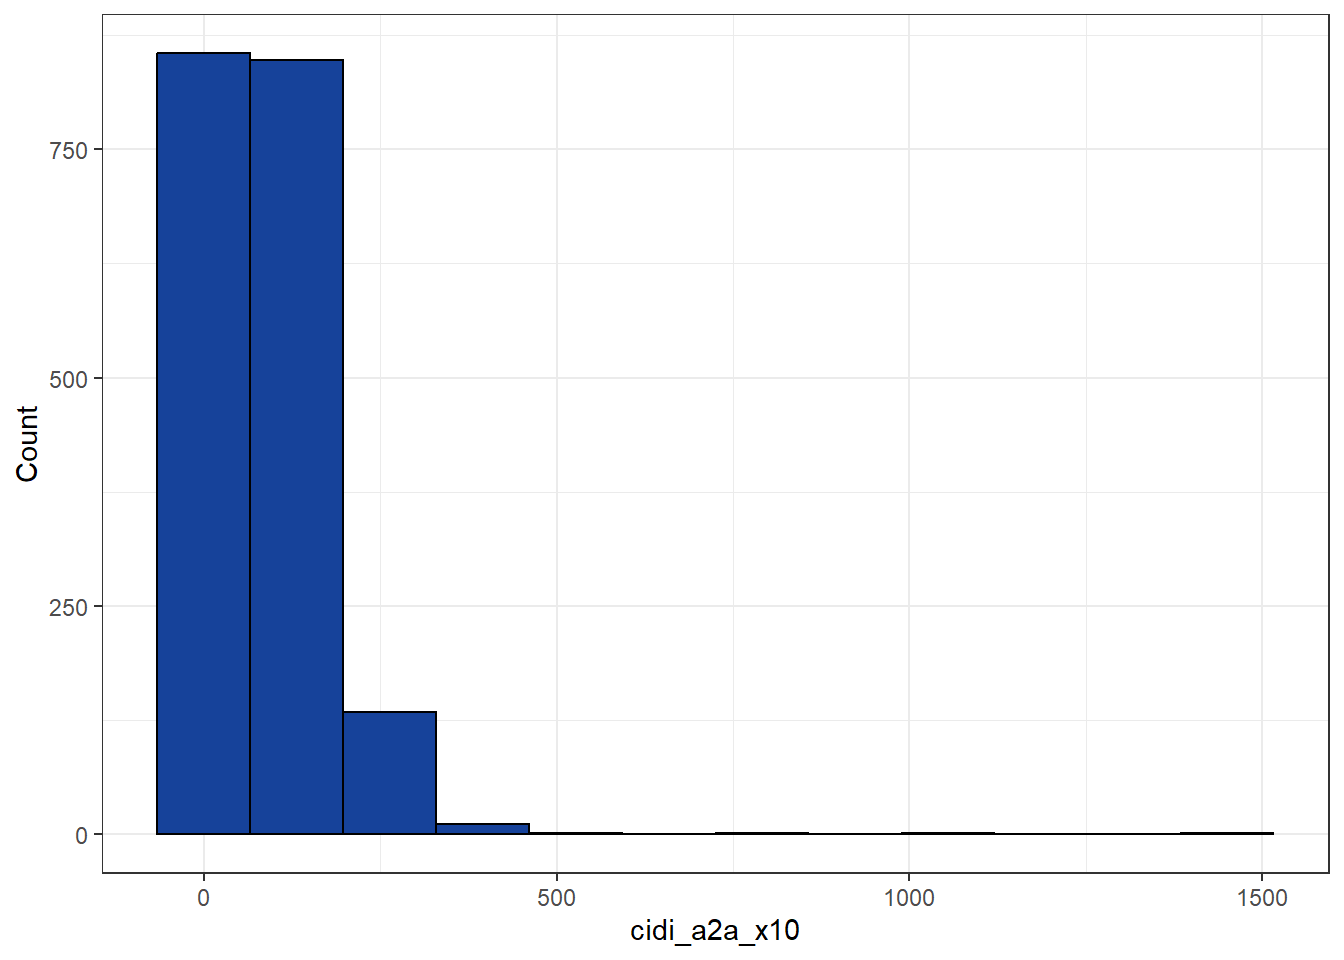
| mean | sd | min | q1 | med | q3 | max | mad | iqr | cv | skewness | se.skewness | kurtosis | n.valid | pct.valid |
|---|---|---|---|---|---|---|---|---|---|---|---|---|---|---|
| 88.57 | 71.53 | 10 | 50 | 70 | 100 | 1460 | 44.48 | 50 | 0.81 | 6.56 | 0.06 | 94.77 | 1852 | 0.36 |
Resurvey 1
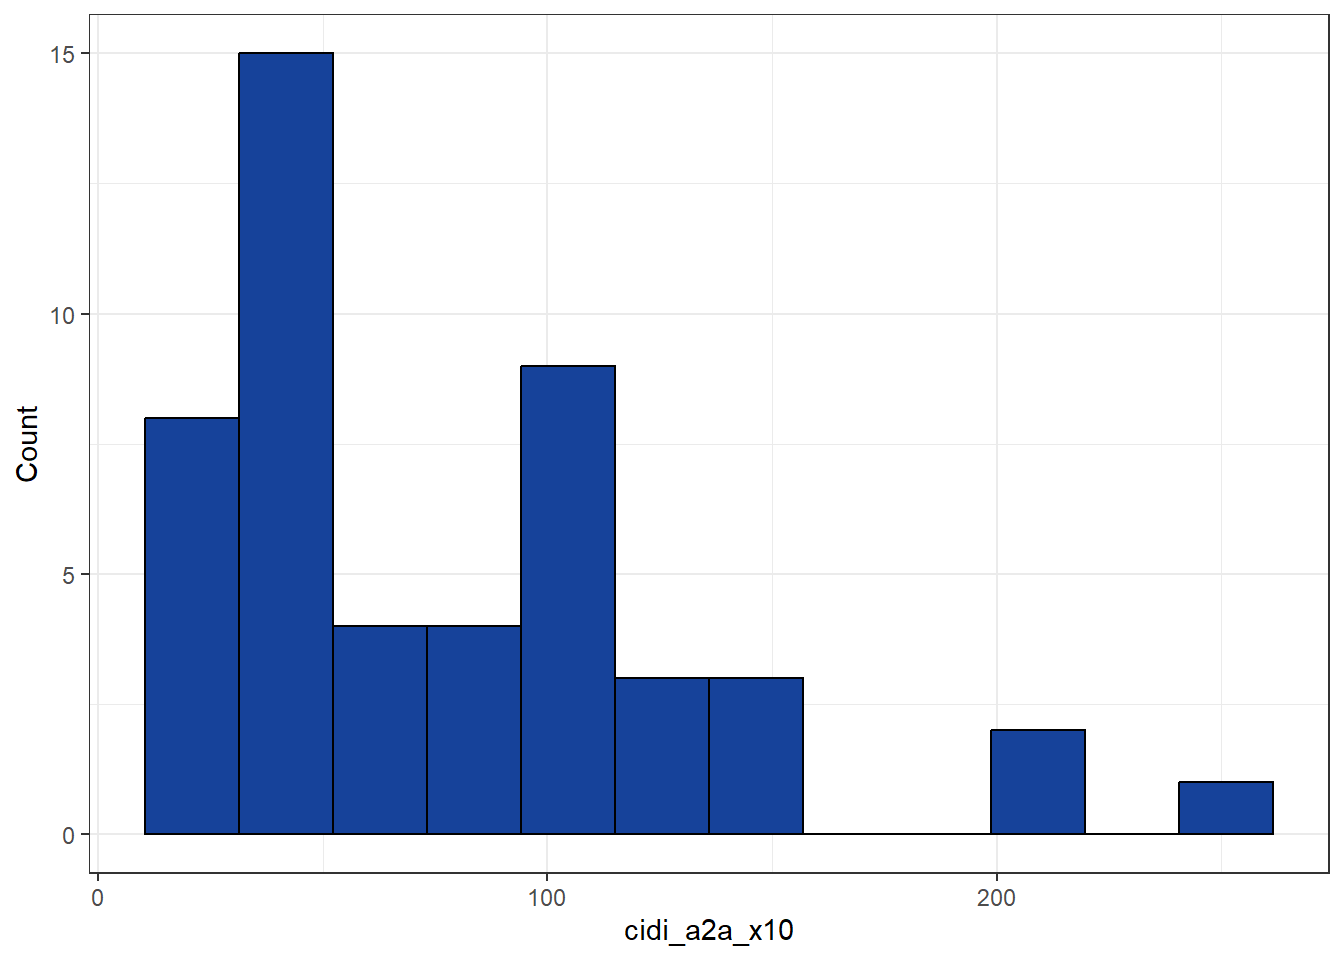
| mean | sd | min | q1 | med | q3 | max | mad | iqr | cv | skewness | se.skewness | kurtosis | n.valid | pct.valid |
|---|---|---|---|---|---|---|---|---|---|---|---|---|---|---|
| 79.39 | 50.76 | 20 | 50 | 60 | 100 | 250 | 44.48 | 50 | 0.64 | 1.28 | 0.34 | 1.45 | 49 | 0.25 |
Resurvey 2
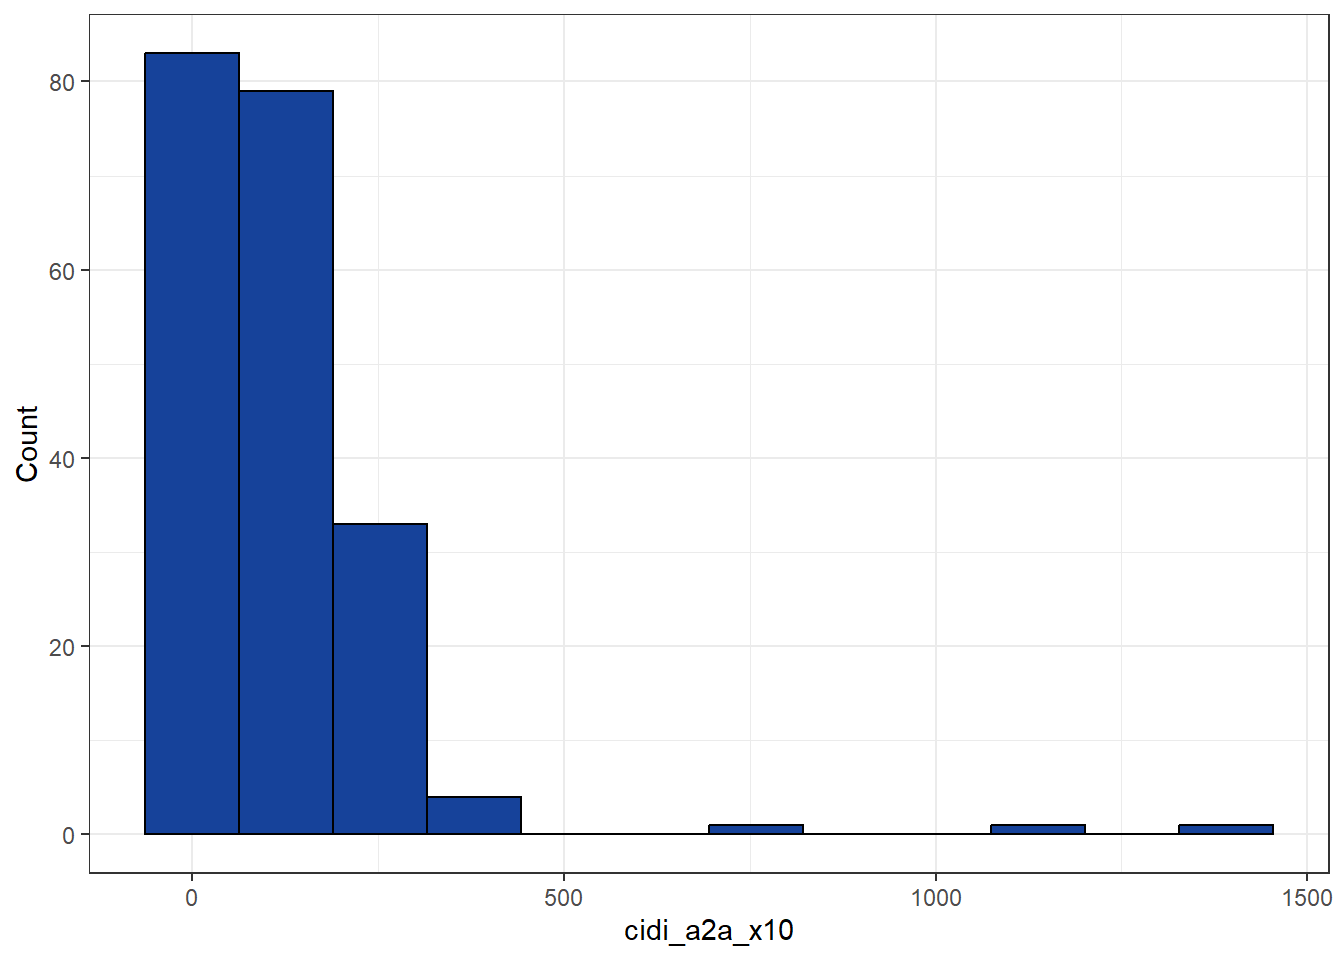
| mean | sd | min | q1 | med | q3 | max | mad | iqr | cv | skewness | se.skewness | kurtosis | n.valid | pct.valid |
|---|---|---|---|---|---|---|---|---|---|---|---|---|---|---|
| 116.66 | 146.7 | 10 | 50 | 95 | 130 | 1400 | 66.72 | 80 | 1.26 | 5.29 | 0.17 | 37.41 | 202 | 0.8 |
Between-survey agreement
[1] “Spearman’s correlation matrix:”| V1 | V2 | V3 |
|---|---|---|
| NA | NA | NA |
| NA | NA | NA |
| NA | NA | NA |
International Coordinating Centre, China Kadoorie Biobank (CKB), CTSU, Nuffield Department of Population Health, University of Oxford Old Road Campus, Headington, Oxford, OX3 7LF
Tel: +44 (0)1865 743743 | Fax: +44 (0)1865 743985 | Email: ckbaccess@ndph.ox.ac.uk
Copyright China Kadoorie Biobank (CKB), University of Oxford, (2024)
Page generated: 27-02-2024